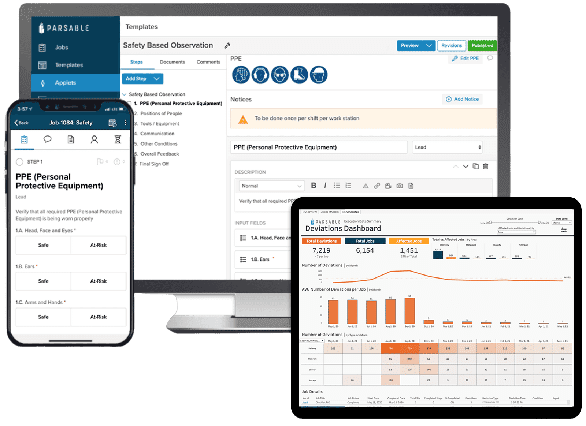
Make improvements to your weekly manufacturing production plan attainment, OEE and average downtime by getting rid of paper on the factory floor.Reduce your manufacturing defect per unit (DPU) rate and the number of quality incidents through real-time alerts and follow-up workflows.Decrease your cost per unit (CPU) and scrap rate while increasing factory productivity with actionable data.Lower your total recordable frequency (TRF), total injury severity (ISS), and lost time incident frequency rates (LTIFR) to meet your plant safety standards.Shorten the amount of time spent on planned and unplanned downtime with digital workflows and embedded SOPs.
No. of Units Planned Per Week
No. of Good Units Produced Per Week
Weekly Planned Production Time
Weekly Good Units
No. of Total Units Produced Per Week
No. of Total Units Reworked Per Week
Avg Changeover Time per Week (hours)
Ideal Run Rate (per hour)
Ideal Cycle Time (per minute)
Quality
No. Customer Complaints
Min: 0
-
Max: 100
Min: 0
-
Max: 100
No. of Failed QA Audits per week
Min: 0
-
Max: 100
Min: 0
-
Max: 100
No. of samples taken per day
Min: 0
-
Max: 100
Min: 0
-
Max: 100
No. of Defects in the Sample per Day
Min: 0
-
Max: 100
Min: 0
-
Max: 100
No. of sample frequency per day
Min: 0
-
Max: 100
Min: 0
-
Max: 100
Cost
Total Manufacturing Cost per week (dollars)
Min: 0
-
Max: 100
Min: 0
-
Max: 100
No. of Hours Worked per Employee
Min: 0
-
Max: 100
Min: 0
-
Max: 100
No. of Shifts
Min: 0
-
Max: 100
Min: 0
-
Max: 100
No. Employees per Shift
Min: 0
-
Max: 100
Min: 0
-
Max: 100
No. Overtime Hours Required per Employee
Min: 0
-
Max: 100
Min: 0
-
Max: 100
Number of Units Waste/Scrap
Min: 0
-
Max: 100
Min: 0
-
Max: 100
Safety & Environment
No. of Safety Incidents per Month
Min: 0
-
Max: 100
Min: 0
-
Max: 100
No. of Work Days Lost per Month
Min: 0
-
Max: 100
Min: 0
-
Max: 100
No. of Light Duty Days per Month
Min: 0
-
Max: 100
Min: 0
-
Max: 100
No. of Lost Time Injuries per Month
Min: 0
-
Max: 100
Min: 0
-
Max: 100
Maintenance
No. of Machine Failures per Week
Min: 0
-
Max: 100
Min: 0
-
Max: 100
Machine Setup Time per Week (hours)
Min: 0
-
Max: 100
Min: 0
-
Max: 100
Weekly Planned Downtime per Week (hours)
Min: 0
-
Max: 100
Min: 0
-
Max: 100
Weekly Unplanned Downtime per Week (hours)
Min: 0
-
Max: 100
Min: 0
-
Max: 100
Adjust the Slider to See an Improvement to Your Plant Scorecard
% 0
On average, Parsable customers see a 5 - 10% improvement for key metrics & KPIs within 6 weeks*
0100
On average, Parsable customers see a 5 - 10% improvement for key metrics & KPIs within 6 weeks*
New Plant Scorecard
You will get a quote and invoice after submitting the form
NameTotal
No. of Units Planned Per Week 0
No. of Good Units Produced Per Week 0
Weekly Planned Production Time 0
Weekly Good Units 0
No. of Total Units Produced Per Week 0
No. of Total Units Reworked Per Week 0
Avg Changeover Time per Week (hours) 0
Ideal Run Rate (per hour) 0
Ideal Cycle Time (per minute) 0
Adjust the Slider to See an Improvement to Your Plant Scorecard 0 %
Weekly Production Plan Attainment$ 0.00
OEE$ 0.00
Weekly Avg Downtime$ 0.00
No. of Customer Complaints per Week$ 0.00
Defect Per Unit Rate$ 0.00
Quality Incidents0
Cost per Unit$ 0.00
Scrap Rate$ 0.00
Productivity$ 0.00
TRFR0
TISR0
LTIFR$ 0.00
Production$ 0.00
Weekly Production Plan Attainment$ 0.00
OEE$ 0.00
Quality$ 0.00
Weekly Avg Downtime0.00
No. of Customer Complaints per Week0.00
Defect Per Unit Rate$ 0.00
Quality Incidents0.00
Cost$ 0.00
Cost per Unit0
Scrap Rate$ 0.00
Productivity0.00
Safety$ 0.00
TRFR0
TISR0.00
LTIFR0
Let Us Walk You Through It
Set up a 1:1 consultation with a Parsable team member for a complimentary walkthrough of the Connected Worker Manufacturing Scorecard Calculator.